Introduction

- In data analysis and management, graph databases that uncover fraud networks have emerged as a powerful tool for finding complex patterns, personalizing customer experiences, and deriving deep data insights. Unlike traditional databases that primarily deal with structured data in a tabular form, graph databases excel in handling highly connected data. This capability makes them invaluable in the insurance industry and beyond, where relationships between entities often hold the key to unlocking valuable insights.
How Graph Databases Work
- At the heart of a graph database are nodes and edges. Nodes represent entities (such as people, accounts, transactions, or devices), while edges denote the relationships between these entities. Each node and edge can have properties that provide more details, allowing for a rich representation of data relationships.
Basic Concepts
- Nodes:The entities or objects in a graph database, akin to records or rows in a relational database.
- Edges: The connections between nodes, representing relationships. They can be directed or undirected and often carry weights indicating the strength or capacity of the connection.
- Properties : Key-value pairs attached to nodes and edges that store additional information about them.
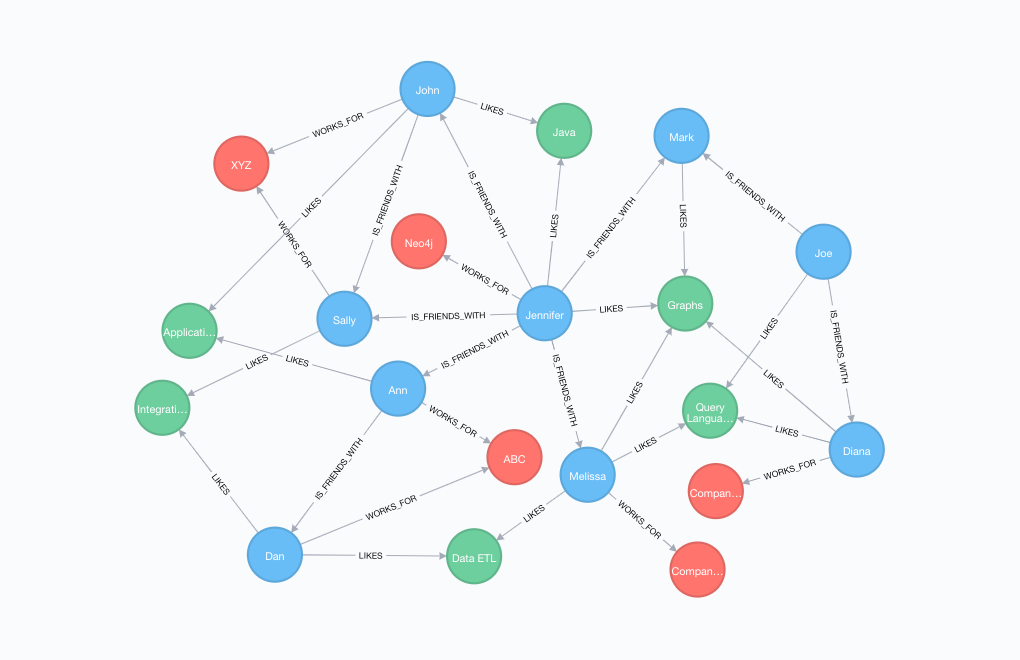
- source:techcrunch
- As shown above, various kind of data points are connected with each other. Such representation can be queries with Graph Query Language. Visualization of such data points can also reveal lots of information.
Industry's Leading Graph Databases
- Several graph databases have gained prominence, each with its unique features and capabilities. Here's a brief comparison of three popular choices:
| Feature / Database | Neo4j | Amazon Neptune | Azure Cosmos DB | TigerGraph | ArangoDB |
|---|---|---|---|---|---|
| Performance | High with native graph storage | High, optimized for connected data | High, with multi-model support | High, with GSQL for fast processing | High, supports multi-model queries |
| Scalability | Horizontal with Enterprise version | Fully managed, scalable service | Global distribution, scalable | Horizontal scalability | Horizontal and vertical scaling |
| Ease of Use | Cypher query language, rich ecosystem | Compatible with Gremlin and SPARQL | SQL API, MongoDB API, Gremlin API | GSQL, similar to SQL, easy to learn | AQL (ArangoDB Query Language), multi-model capabilities |
| Query Language | Cypher | Gremlin, SPARQL | SQL, Gremlin, MongoDB's query language | GSQL | AQL, supports graph and document queries |
| Licensing | Community (GPLv3) and Enterprise editions | Proprietary, pay-as-you-go | Proprietary, pay-as-you-go | Community Edition and Commercial licenses | Open Source (Apache 2.0) and Enterprise versions |
| Community Support | Strong community, wide adoption | Amazon support, growing community | Strong support from Microsoft, growing community | Growing community, strong enterprise support | Strong community and open-source involvement |
A Detailed Use Case: Detecting Insurance Fraud
- For the described scenario, let's construct a sample graph database query using a hypothetical graph query language similar to Cypher, which is used by Neo4j, one of the most popular graph databases. The scenario involves tracing potentially fraudulent insurance claims indirectly connected through shared device IDs or beneficiary accounts across different parts of the city. The query aims to find clusters of claims that may indicate fraudulent activities.
Hypothetical Graph Structure:
- Nodes:Claims, Devices, BeneficiaryAccounts, Locations
- Relationships:
- Claims
SUBMITTED_FROMLocation - Claims
MADE_USINGDevice - Claims
BENEFITSBeneficiaryAccount
- Claims
Query Objective:
- Identify clusters of insurance claims that share the same device ID or beneficiary account but originate from diverse locations. These clusters may suggest a pattern of fraudulent activity.
Sample Query:
MATCH (c1:Claim)-[:MADE_USING]->(d:Device)<-[:MADE_USING]-(c2:Claim),
      (c1)-[:BENEFITS]->(b:BeneficiaryAccount)<-[:BENEFITS]-(c2),
      (c1)-[:SUBMITTED_FROM]->(l1:Location),
      (c2)-[:SUBMITTED_FROM]->(l2:Location)
WHERE c1 <> c2 AND l1 <> l2
WITH c1, c2, collect(d) AS SharedDevices, collect(b) AS SharedBeneficiaryAccounts, collect(l1) AS Locations1, collect(l2) AS Locations2
RETURN c1, c2, SharedDevices, SharedBeneficiaryAccounts, Locations1, Locations2
ORDER BY size(SharedDevices) DESC, size(SharedBeneficiaryAccounts) DESC
LIMIT 10;
Query Explanation:
-
MATCH: Looks for patterns where two different claims (
c1andc2) are made using the same device (d) and benefit the same beneficiary account (b). Additionally, these claims are submitted from different locations (l1andl2). -
WHERE: Ensures that the two claims being compared are not the same (
c1 <> c2) and originate from different locations (l1 <> l2). -
WITH: Aggregates shared devices, beneficiary accounts, and locations for each pair of claims, allowing us to analyze the connections between them.
-
RETURN: Returns the claims, their shared devices, beneficiary accounts, and the locations from which they were submitted.
-
ORDER BY: Orders the results by the number of shared devices and beneficiary accounts, prioritizing clusters with more shared elements which could indicate stronger links for potential fraud.
-
LIMIT: Limits the results to the top 10 pairs of claims with the most significant connections, making it easier for analysts to investigate.
-
This query is designed to help insurance analysts quickly identify and investigate suspicious claim clusters that might indicate fraudulent activities, by leveraging the connected data nature of graph databases.
Scenario:
- In the insurance industry, there are lots of leads coming from different sources. There are multiple followups, re-marketing campaigns from different channels and engagement is taking place. Now, with graphdb we can used to analyse cross channel communications, retargeting and lead scoring to effectively predict how much to spend on user and efforts to be made.
A Detailed Use Case: Finding a pattern in customer engagement
- An insurance company uses various channels, such as email, social media, phone calls, and online ads, for lead generation and retargeting campaigns. Each lead interacts with these channels differently, displaying a unique pattern of engagement that can be tracked and analyzed. The company aims to maximize its marketing ROI by understanding these patterns, identifying the most promising leads, and customizing its follow-up strategies accordingly.
Graph Database Structure:
- Nodes: Leads, Channels (Email, SocialMedia, Phone, OnlineAds), Campaigns, Interactions
- Relationships:
- Leads
ENGAGED_WITHChannels - Leads
PARTICIPATED_INCampaigns - Channels
UTILIZED_INCampaigns - Leads
HADInteractions
- Leads
Query Objective:
- Identify leads with high engagement scores across multiple channels and predict optimal marketing spend and effort for each lead based on their interaction history and engagement levels.
Sample Query:
Assuming a query language similar to Cypher:
MATCH (l:Lead)-[eng:ENGAGED_WITH]->(c:Channel),
      (l)-[part:PARTICIPATED_IN]->(camp:Campaign),
      (l)-[had:HAD]->(i:Interaction)
WITH l, collect(DISTINCT c) AS ChannelsEngaged, collect(DISTINCT camp) AS CampaignsParticipated, count(i) AS TotalInteractions
WHERE size(ChannelsEngaged) > 2 AND TotalInteractions > 5
MATCH (l)-[eng:ENGAGED_WITH]->(c:Channel)
WITH l, ChannelsEngaged, CampaignsParticipated, TotalInteractions, sum(eng.score) AS EngagementScore
ORDER BY EngagementScore DESC
RETURN l.id AS LeadID, ChannelsEngaged, CampaignsParticipated, TotalInteractions, EngagementScore
LIMIT 10;
Query Explanation:
-
MATCH: Finds leads that have engaged with various channels, participated in campaigns and had interactions.
-
WITH: Aggregates the channels each lead engaged with, the campaigns they participated in, and the total number of interactions.
-
WHERE: Filters for leads engaging with more than two channels and having more than five interactions to focus on highly active leads.
-
MATCH & WITH (again): Matches the leads to their engagement again to calculate the engagement score by summing the scores from engagements with different channels.
-
ORDER BY: Sorts the leads based on their engagement score to prioritize those with higher engagement.
-
RETURN: Returns the lead ID, the channels they engaged with, the campaigns they participated in, their total number of interactions, and their overall engagement score.
-
LIMIT: Limits the results to the top 10 leads to focus on those with the highest potential ROI for targeted marketing efforts.
-
This query helps the insurance company identify and prioritize leads most receptive to their marketing efforts across multiple channels. By analyzing engagement patterns and scoring leads based on their interactions, the company can optimize its marketing spend and customize follow-up strategies to increase conversion rates effectively.
Process Of Using Graph Databases to Uncover Fraud Networks
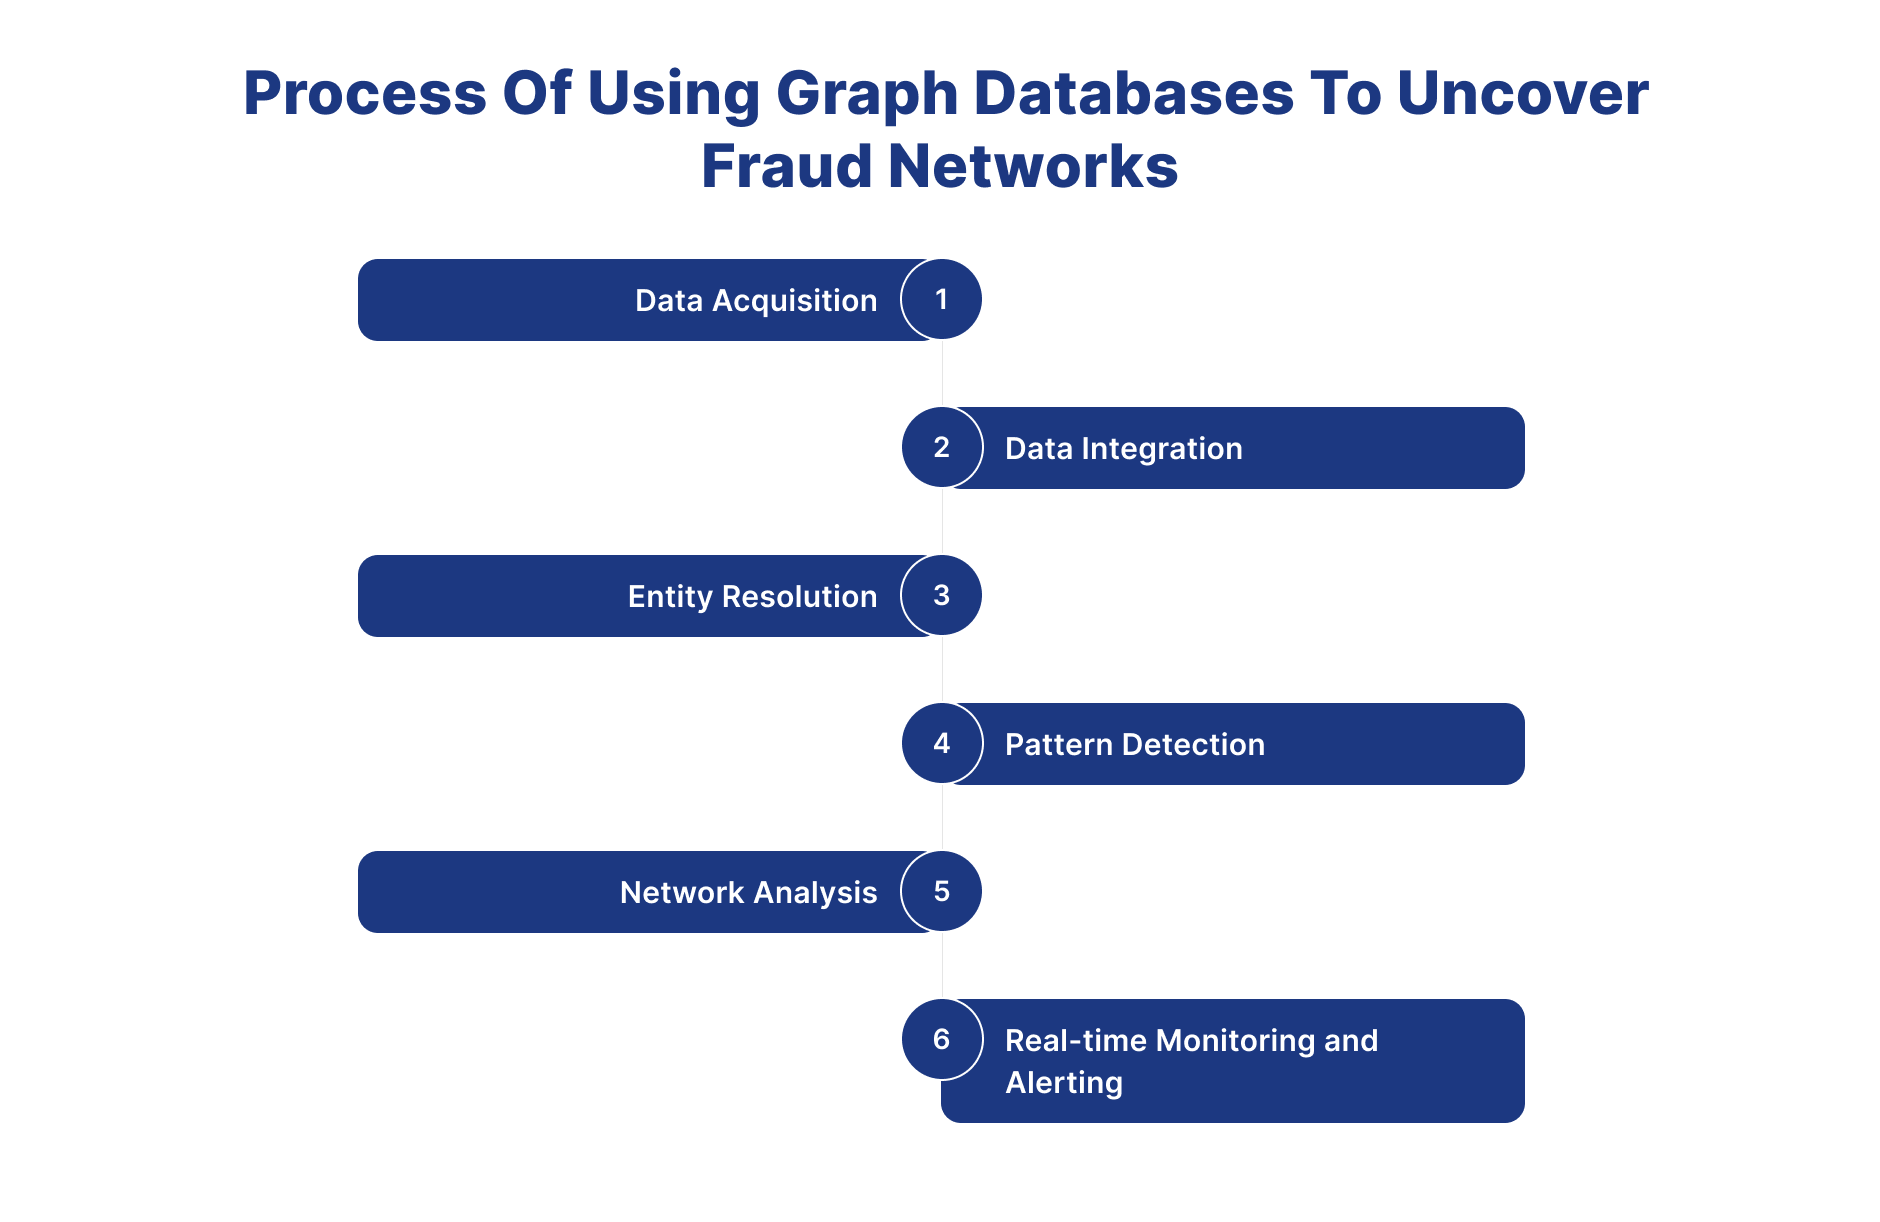
1.Data Acquisition
- The initial step in employing graph databases for fraud detection is to collect relevant data sources. This might contain transactional data, customer profiles, device information, and historical records. Data can be retrieved from internal databases, third-party sources, or via APIs and data feeds. The idea is to collect broad and diversified datasets that offer information about potential fraudulent actions.
2.Data Integration
- After collecting the data, the following step is to incorporate it into the graph database. Graph databases are excellent at expressing complicated interactions between things, making them suitable for modelling fraud networks. Data integration entails mapping the links between things such as customers, transactions, accounts, and devices, resulting in a linked graph structure that reflects the interactions and dependencies in the data.
3.Entity Resolution
- Entity resolution is an important step in fraud detection, especially when working with different datasets that include duplicate or missing information. Graph databases provide efficient entity resolution by finding and combining duplicate entities using similarity metrics and linking rules. This guarantees that the graph's entities are represented comprehensively and accurately. It is similar to building a schema in relational databases.
4.Pattern Detection
- The next stage after integrating the data and resolving the entities is to find trends and anomalies that indicate fraudulent behaviour. Graph databases provide strong query languages and algorithms for analysing graph data and detecting suspicious patterns, such as anomalous transactional behaviour, relationships between apparently unconnected organisations, or patterns that match established fraud schemes.
5.Network Analysis
- One of the primary advantages of graph databases is their capacity to do network analysis, which reveals hidden linkages and connections within the data. Network analysis techniques such as centrality measurements, community detection, and path analysis may expose the structure and dynamics of fraud networks, assisting investigators in identifying important players, hubs, and paths involved in fraudulent activity.
6.Real-time Monitoring and Alerting
- Fraud detection is a continuous activity necessitating real-time monitoring and warning capabilities. Graph databases provide continuous monitoring of data streams and incoming transactions, allowing organisations to detect and respond to fraudulent activity in real time. Businesses can reduce risks and avoid financial losses by putting in place automatic warning mechanisms based on specified rules and limits.
Things You Should Consider While Choosing Right GraphDB
1.Scalability
- Scalability is an important factor to consider when selecting a graph database for fraud detection. As the number of data and complexity of fraud schemes increase, it is critical to choose a graph database that can manage large-scale data sets while also meeting the growing demands of real-time analysis. Look for a graph database that has horizontal scalability, which means you can add nodes and clusters as your data requirements grow without sacrificing speed.
2.Performance
- Another important component in fraud detection is performance, since fast detection and reaction might mean the difference. Choose a graph database that provides high-performance query processing, allowing for quick and efficient examination of complicated relationships and patterns in the data. Look for features like index-free adjacency and optimised query execution plans to ensure fast response times, especially with huge and linked datasets.
3.Flexibility
- Fraud detection necessitates adaptability in data modelling and query skills to changing fraud methods and detection tactics. Look for a graph database that offers flexible schema models, which allow you to express various entities and relationships in the data without imposing hard limits. Choose a database with a rich query language and powerful traversal algorithms, allowing analysts to thoroughly explore and analyse the data.
4.Security
- Security is critical in fraud detection, since sensitive data must be safeguarded from unauthorised access and alteration. Make sure the graph database you chose has strong security features, such as encryption at rest and in transit, role-based access control, and auditing capabilities. Look for compliance certifications and adherence to industry standards to guarantee that your data is secure and meets regulatory criteria.
5.Ecosystem and Integration
- Consider the graph database's ecosystem and integration capabilities, since smooth interface with current tools and platforms is critical for successful fraud detection. Choose a database that supports all common programming languages, data integration frameworks, and analytics tools. Additionally, check for built-in connections and APIs that allow for integration with data sources, streaming platforms, and visualisation tools, resulting in a unified and faster fraud detection workflow.
6.Community and Support
- Finally, assess the community and support for the graph database, since continuing assistance and resources are crucial for effective adoption and maintenance. Choose a database that has an active development and user community and provides tools, documentation, and community-driven plugins and extensions. Consider the database vendor's degree of assistance, such as technical support, training programmes, and professional services, to ensure that you have the help and expertise you need to get the most out of your investment
Process For Preparing Schema For GraphDB
1.Define Entities and Relationships
-
The first step in creating a schema for graph databases is to identify the items and connections that are important to business use cases. Determine the essential entities involved, including lead, proposals, policies, partners, devices, claims, payments etc. Then, identify the linkages between these entities, such as partner-customer transactions, device usage trends, claim trends. Clearly describing entities and interactions is critical for developing a complete graph model that depicts the linked nature of fraudulent activity.
-
Business Analyst can gather such details from different departments and gather in raw format. Later, such data can be refined and used for defining the schema.
2.Identify Fraud Patterns, customer experiences, data insights and Anomalies
- Once the entities and connections have been specified, the next step is to look for fraud trends and anomalies that might indicate fraudulent activity. Collaborate with fraud analysts, marketing, product, sales, claims and domain specialists to uncover insights and strategies specific to your industry and business. This might involve trends like anomalous transactional behaviour, identity theft, account takeovers, and collaboration among several companies. Understanding the exact trends and anomalies to identify allows you to build your schema to collect the most relevant data points and connections.
3. Model Data for Analysis
-
With a firm grasp on entities, relationships, and fraud patterns, it's time to model the data for analysis in the graph database. Consider how to represent entities and connections in the graph model such that they correctly reflect real-world interactions and dependencies in the data. Property graphs are useful for capturing properties and metadata associated with entities and connections.
-
Before putting data on the database all the scenarios should be tried on the schema to assure schema will be able to answer all the questions.
4.Incorporate Historical Data and Context
- Including historical data and context is critical for developing a strong schema. Historical data gives significant insights into previous fraud instances and patterns, allowing for the discovery of repeating fraud schemes and potential risks. Consider how to include historical data into the graph database, making it available for analysis and comparison with real-time data. Also, collect contextual information such as transaction context, user behaviour, and environmental elements that may impact fraud risk and detection.
5.Iterate and Refine
- Creating a schema for graph databases is an iterative process that needs ongoing modification and optimisation. Begin with a basic schema design and iterate on it based on feedback from fraud analysts, data scientists, and end users. To assess the schema's efficacy in detecting known fraud patterns and anomalies, run it through sample data sets and simulations. Iterate on the schema design using the insights acquired from testing and real-world use cases, fine-tuning entity definitions, connection mappings, and data modelling methodologies as appropriate.
Process For Preparing Schema For GraphDB
1.Define Entities and Relationships
-
The first step in creating a schema for graph databases is identifying the items and connections important to business use cases. Determine the essential entities involved, including leads, proposals, policies, partners, devices, claims, payments, etc. Then, identify the linkages between these entities, such as partner-customer transactions, device usage trends, and claim trends. Clearly describing entities and interactions is critical for developing a complete graph model that depicts the linked nature of fraudulent activity.
-
The Business Analyst can gather such details from different departments in raw format. Later, such data can be refined and used to define the schema.
2.Identify Fraud Patterns, customer experiences, data insights, and Anomalies
- Once the entities and connections have been specified, the next step is to look for fraud trends and anomalies that might indicate fraudulent activity. Collaborate with fraud analysts, marketing, product, sales, claims, and domain specialists to uncover insights and strategies for your industry and business. This might involve trends like anomalous transactional behavior, identity theft, account takeovers, and collaboration among several companies. Understanding the exact trends and anomalies to identify allows you to build your schema to collect the most relevant data points and connections.
3.Model Data for Analysis
-
With a firm grasp on entities, relationships, and fraud patterns, it's time to model the data for analysis in the graph database. Consider how to correctly represent entities and connections in the graph model to reflect real-world interactions and dependencies in the data. Property graphs are helpful for capturing properties and metadata associated with entities and connections.
-
Before putting data in the database, the schema should be tested for all scenarios to ensure that it can answer all the questions.
4.Incorporate Historical Data and Context
- Including historical data and context is critical for developing a strong schema. Historical data gives significant insights into previous fraud instances and patterns, allowing for the discovery of repeating fraud schemes and potential risks. Consider how to include historical data into the graph database, making it available for analysis and comparison with real-time data. Also, collect contextual information such as transaction context, user behaviour, and environmental elements that may impact fraud risk and detection.
5.Iterate and Refine
- Creating a schema for graph databases is an iterative process that requires ongoing modification and optimization. Begin with a basic schema design and iterate on it based on feedback from fraud analysts, data scientists, and end users. Run the schema through sample data sets and simulations to assess its efficacy in detecting known fraud patterns and anomalies. Iterate on the schema design using the insights acquired from testing and real-world use cases, fine-tuning entity definitions, connection mappings, and data modeling methodologies as appropriate.
BI tools can be used to visualize the graph databases.
1.Tableau
- Tableau does not have a native connector for GraphDB, but it does have a REST API that allows developers to create custom connectors. This will enable you to connect Tableau to GraphDB and visualize graph data on the platform.
2.Looker
- Similar to Tableau, Looker lacks a built-in GraphDB connectivity. Looker does, however, permit custom connector development, allowing you to connect to GraphDB and analyze your graph data.
3.Microsoft Power BI
- Power BI provides limited native support for graph databases. It cannot connect directly to GraphDB but can deal with RDF (Resource Description Framework) data. If your GraphDB data is stored in RDF format, you can connect and visualize it with Power BI. However, this may need further configuration and data translation.
4.Sisense
- Sisense has a SPARQL connection, which is a query language developed exclusively for searching RDF data. If your GraphDB stores data in RDF format, you might link it to Sisense and use SPARQL queries to analyze your graph.
5.Apache Zeppelin
- Zeppelin is a notebook-style business intelligence application that supports a variety of data sources, including graph databases. It enables you to connect to GraphDB using Gremlin, a popular graph query language, and analyze data within the Zeppelin notebook environment.
6.Apache Superset
- Superset is another open-source business intelligence solution without a native GraphDB connectivity. However, like Tableau and Looker, it supports custom SQLAlchemy connections. You can build a custom connection to bridge the gap between Superset and GraphDB with little work.
Comparison with Relational Database
| Aspect | Graph Databases | SQL Databases (PostgreSQL, MySQL) |
|---|---|---|
| Data Model | Represented as nodes, edges, and properties. Nodes represent entities, edges represent relationships, properties capture attributes. | Organized into tables with rows and columns. Tables represent entities, relationships via foreign keys. |
| Query Language | Specialized query languages: Cypher (Neo4j), Gremlin (Apache TinkerPop). Optimized for traversing and analyzing graphs. Support for graph traversal, pattern matching, and algorithms. | SQL (Structured Query Language). Supports filtering, sorting, joining, aggregating data in relational tables. |
| Performance | Excellent for querying highly interconnected data. Performance may vary based on graph size and complexity. Requires optimized indexing and query execution plans. | Optimized for querying structured data. Efficient execution of SQL queries. Performance may degrade for complex operations or large datasets. |
| Use Cases | Social networks, recommendation engines, fraud detection, network analysis. Analyzing connections and interactions between entities. | Transaction processing, data warehousing, content management, e-commerce. Emphasis on transactional consistency and data integrity. |
| Schema Flexibility | Dynamic schema: entities, relationships can be added/modified without altering schema. Suited for evolving data models or unknown relationships up front. | Rigid schema structure: tables, columns must be defined upfront. Schema changes require careful planning and downtime for maintenance. |
| Scalability | Optimized for graph traversals and complex queries. Scalability challenge for large-scale graphs. Requires careful optimization and scaling strategies. | Well-suited for handling structured data. Robust scalability options (sharding, replication, clustering) for horizontal scaling. |
| Use of Indexing | Label-based indexing, property indexing for efficient graph traversal. Speeds up traversal, improves query performance. | Various indexing techniques: B-tree, hash, GiST. Accelerates search and retrieval operations on relational columns. |
| Data Modeling | Property graph or triple-store model: nodes, edges, properties or subject-predicate-object triples. Flexible representation with rich semantics. | Relational model: tables, rows, columns. Relationships via foreign keys. Emphasizes data normalization, predefined schemas. |
how to build a pipeline from SQL databases to GraphDB
- Most of the world's data is stored in Relational databases. Here is the process for building data pipelines, from relational to graph databases.
Data Extraction
-
The first step in building a pipeline is to extract data from the source SQL database. Depending on the database platform (e.g., PostgreSQL, MySQL, SQL Server), various methods can be used for data extraction. Common techniques include:
- Using SQL queries to extract data from tables and views.
- Exporting data in CSV, Parquet, ORC, or JSON format using database tools or command-line utilities.
- Utilizing database connectors or APIs for programmatic access to data.
Data Transformation
-
Once the data is extracted, it may need to be transformed to fit the schema and data model of the target graph database. This step involves:
- Mapping SQL tables to nodes and relationships in the graph database schema.
- Transforming column values and data types to match the requirements of the graph database.
- Enriching the data with additional properties or attributes as needed for graph analysis.
Data Loading
-
After transformation, the next step is to load the transformed data into the graph database. Depending on the graph database platform (e.g., Neo4j, Amazon Neptune), different loading methods can be used:
- Using built-in import tools or utilities provided by the graph database vendor.
- Programmatically inserting data using database connectors or APIs.
- Bulk loading data from CSV or JSON files for efficient batch processing.
Schema Mapping
-
Mapping the SQL database schema to the graph database schema is critical to the pipeline. This involves:
- Identify entities and relationships in the SQL database schema and map them to nodes and edges in the graph database schema.
- Defining property mappings to map column values from the SQL database to node and edge properties in the graph database.
- Establishing constraints and indexes in the graph database schema to enforce data integrity and optimize query performance.
Data Synchronization
-
To ensure data consistency between the SQL database and the graph database, it's essential to implement data synchronization mechanisms:
- Implementing change data capture (CDC) techniques to capture and replicate incremental changes from the SQL and graph databases. Most of the modern databases support the CDC.
- Setting up scheduled data synchronization jobs or triggers to keep the graph database up-to-date with the latest changes from the SQL database.
- Monitoring data synchronization processes and handling data conflicts or errors to maintain data integrity.
Testing and Validation
-
Before deploying the pipeline into production, thorough testing and validation are necessary to ensure its reliability and performance:
- Performing data integrity checks to verify that data is accurately transformed and loaded into the graph database.
- Test query performance and optimize indexing and query execution plans for efficient data retrieval and analysis.
- Validating data synchronization processes to ensure that changes from the SQL database are correctly propagated to the graph database in real time.
Conclusion
- Graph databases to uncover fraud detection offer an innovative approach, enhancing customer experiences, and gaining deeper data insights. By understanding the basic principles of how graph databases work and comparing the leading options, organizations can leverage this technology to navigate complex data relationships effectively. The choice between ArangoDB, Neo4j, and Amazon Neptune will depend on specific project requirements, ecosystem compatibility, and scalability needs, paving the way.

